How to Measure eCommerce Website Performance: 10 Metrics, Tests, and Fixes

Your store is leaking revenue and the dashboard doesn’t show it. A shopper lands on a product page, the hero image hasn’t rendered, the add to cart button doesn’t respond on first tap, and the session ends with no order placed and no record of why it failed. That gap between shopper experience and reported analytics is where eCommerce website performance measurement lives.
This guide covers how to measure eCommerce website performance end to end. You will get the 10 metrics worth tracking, the tools that measure each one, the four types of performance tests every online store should run, a five-step testing process, the common reasons stores slow down, and the fixes that move the conversion number. If you run on WordPress, FluentCart ships most of these tracking and checkout tools as built-in features, so the work shifts from stitching tools together to watching the right numbers.
TL;DR
- eCommerce website performance is the combined effect of speed, stability, and conversion behavior on store revenue.
- Track 10 eCommerce website performance metrics across traffic, engagement, technical health, and conversion.
- Use a four-tool stack: built-in store analytics, Google’s Core Web Vitals tools, a web analytics platform, and a performance testing platform.
- Run four types of eCommerce website performance testing: load, stress, spike, and scalability.
- A 0.1 second site speed gain can lift retail conversions by 8.4% and average order value by 9.2%, per Deloitte and Akamai research.
- A WordPress-native commerce setup with built-in store analytics gives you cleaner ownership of these numbers.
What is eCommerce website performance?
Ecommerce website performance is how well your online store delivers a shopping session, measured across speed, stability, engagement, and conversion. It covers technical signals like page load time and Core Web Vitals, business signals like conversion rate and average order value, and traffic signals like unique visitors and organic traffic. Slow on any one of those, and revenue gets quieter without warning.
Performance is not a single number on a dashboard. It is a small bundle of metrics that, read together, tell you whether your store is healthy, whether shoppers can finish a purchase, and whether new traffic pays for itself. The rest of this guide breaks that bundle into something you can audit this week.
Why measuring eCommerce website performance matters
Performance has a direct line to revenue. A 0.1 second improvement in site speed can lift retail conversions by 8.4% and average order value by 9.2%, according to Deloitte and Akamai’s research on speed and shopper behavior. Pages that take longer than four seconds to load see bounce rates near 63%, per Yottaa’s Web Performance Index. Google’s own mobile research shows users are 32% more likely to bounce when load time grows from one second to three seconds.
These are not vanity numbers. They translate into fewer orders, lower order values, and a rising acquisition cost. If you can’t measure the slowdowns, you can’t price the loss, and you can’t justify the fixes.
10 eCommerce website performance metrics to track
Choose the metrics that match your buyer journey. The 10 below are a working baseline that covers traffic quality, engagement, technical health, and conversion outcomes. They sit within the broader set of eCommerce KPIs a store should track, filtered here to the signals with a direct line to performance measurement.
1. Total visits
Total visits is the count of all sessions on your store over a given period, weekly, monthly, or quarterly. It gives a quick read on whether marketing, organic search, or social referrals are pushing the right volume of traffic. Compare your store to its own past performance rather than to a much larger or differently positioned competitor.
2. Unique visitors
Unique visitors counts each shopper once, no matter how many times they returned during the reporting window. Dividing total visits by unique visitors gives you average sessions per visitor, which tells you how much your store earns repeat browsing. A returning shopper signals interest. Strong repeat browsing usually predicts higher conversion later.
3. Pages per session
Pages per session is the average number of pages a visitor views in a single session. Low pages per session on category and product pages is a signal to review on-page recommendations, related products, internal linking, and calls to action. High pages per session paired with low conversion usually points to product discovery problems, not awareness problems.
4. Average session duration
Average session duration tracks how long visitors stay on your store. Longer sessions correlate with more product views and more cart adds. Read this together with pages per session, since high duration with low page count can also mean a shopper got stuck on one slow page.
5. Bounce rate
Bounce rate is the percentage of visitors who land, view fewer than two pages, spend under 10 seconds, and leave without converting. A higher than expected bounce rate usually has one of three causes: a slow first paint on the landing page, weak product page copy, or a mismatched ad-to-page promise. Each one shows up differently in session recordings, so it is worth diagnosing before fixing.
6. Conversion rate
Conversion rate is the percentage of visitors who finish a purchase. Calculation: orders divided by sessions. For a 100-visitor day with five orders, conversion rate is 5%. Most of the technical fixes later in this guide exist to move this single number, since a 0.5 percentage point gain compounds across every traffic source you already pay for. For a structured view of what is keeping that number lower than it should be, an eCommerce CRO audit is the most direct path to finding the specific friction points.
7. Cost per acquisition
Cost per acquisition (CPA) is what you spend, on average, to convert one paying customer. Divide total campaign spend by the number of orders driven by that spend. If CPA is climbing while conversion is flat, the store has either a traffic quality problem or a performance bottleneck dragging down the close rate after the click lands.
8. Organic traffic
Organic traffic is the share of visitors arriving from unpaid search. It is the cheapest sustainable acquisition channel, and it doubles as a quality signal. Search engines reward fast, stable, well-structured stores. If organic traffic dips during a Google core update, performance signals are usually part of the reason, alongside content quality changes.
9. Largest Contentful Paint and Core Web Vitals
Largest Contentful Paint (LCP) measures how long the largest visible element on the page takes to render. Google uses three Core Web Vitals as user-experience signals: LCP at or under 2.5 seconds, Interaction to Next Paint (INP) at or under 200 milliseconds, and Cumulative Layout Shift (CLS) at or under 0.1. Google scores these at the 75th percentile of real users, not on your fastest test runs.
10. Page load speed
Page load speed is the total time a page takes to display in a shopper’s browser. Faster pages reduce bounce rate and lift conversion, especially on mobile networks where conditions vary. Page load speed is where most eCommerce website performance work earns its return, and it sits upstream of almost every other metric on this list.
What tools should you use to measure eCommerce website performance?
A complete measurement stack covers four jobs: track revenue and customer behavior inside the store, score technical health against Google’s standards, watch real shopper experience in production, and simulate load before sale events. No single tool covers all four well. The categories below pair each job with the right kind of tool, so you can pick one per category instead of stitching ten together.
Built-in store analytics
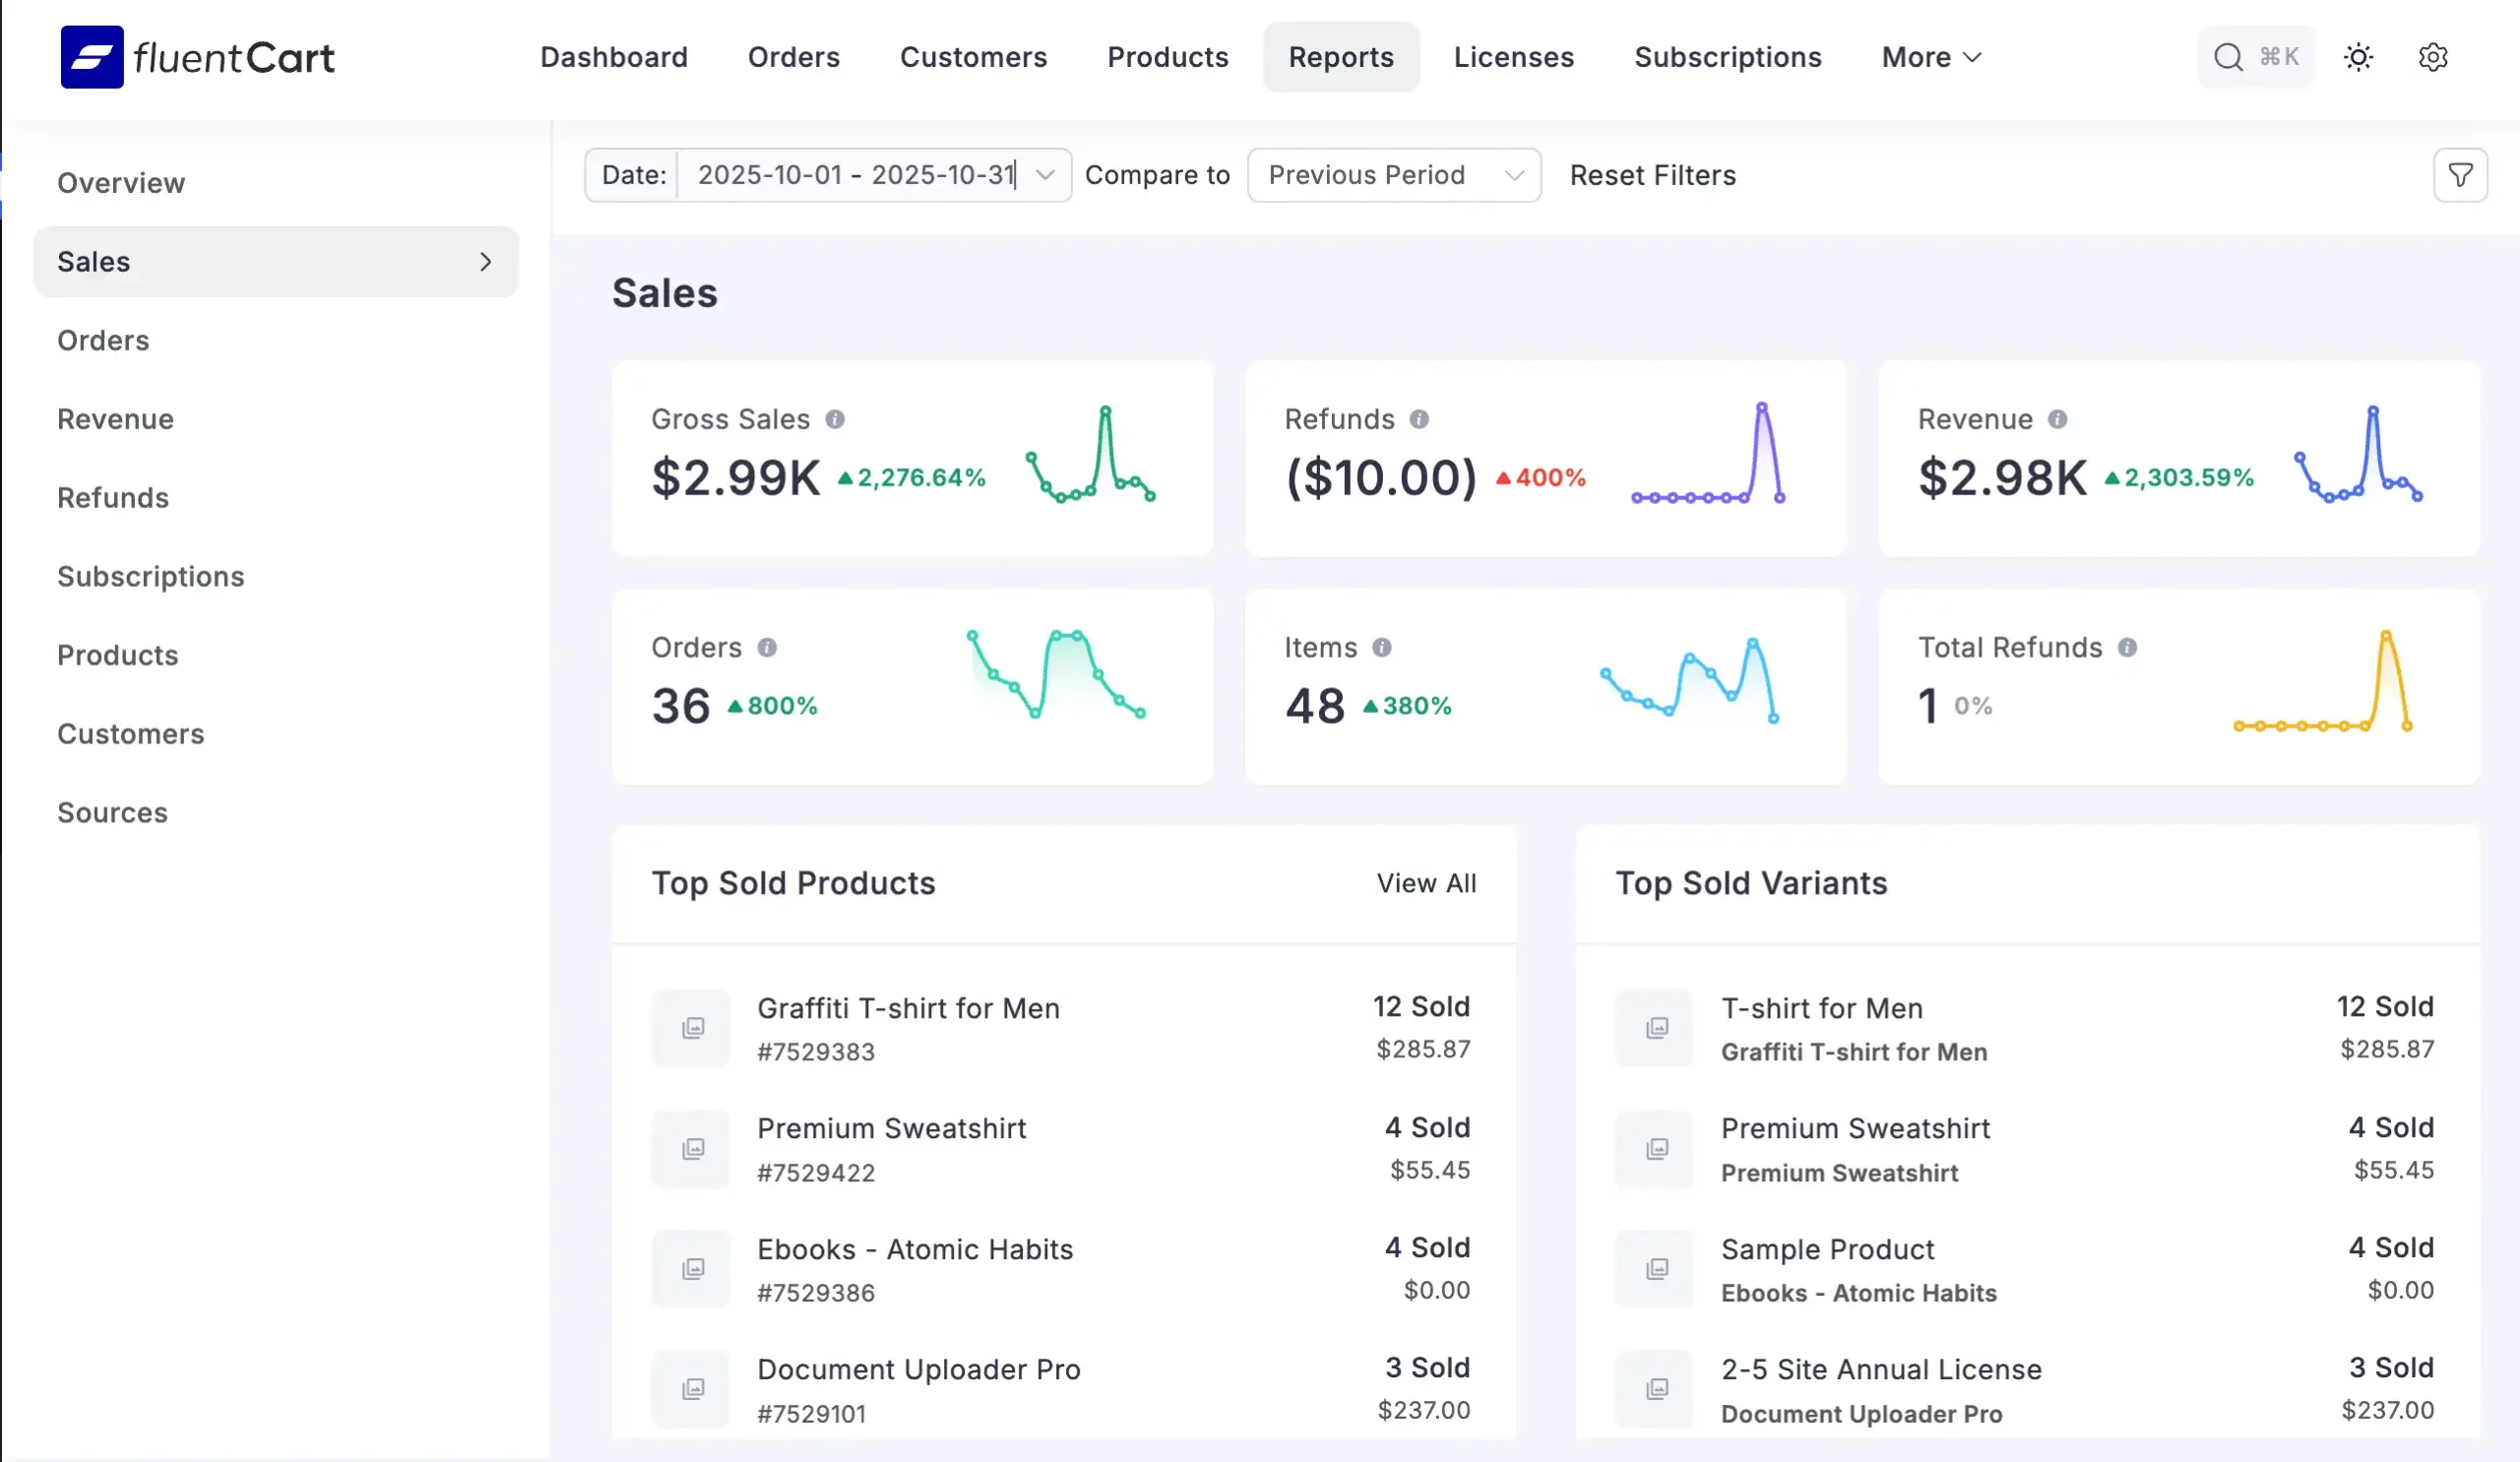
A self-hosted commerce plugin gives you native dashboards for the conversion-side metrics: conversion rate, refund record, average order value, customer LTV, new vs returning customers, order heatmaps, subscription analytics, license stats, and granular revenue analysis. FluentCart’s native reporting is one example, and because the data sits on your own server, there is no query rate limit and no third-party export to pay for. Built-in analytics is the right tool for tracking metrics 5 through 7 on the list above (bounce signals tied to checkout, conversion rate, and CPA tied to order-level revenue).
Google’s Core Web Vitals and page speed tools
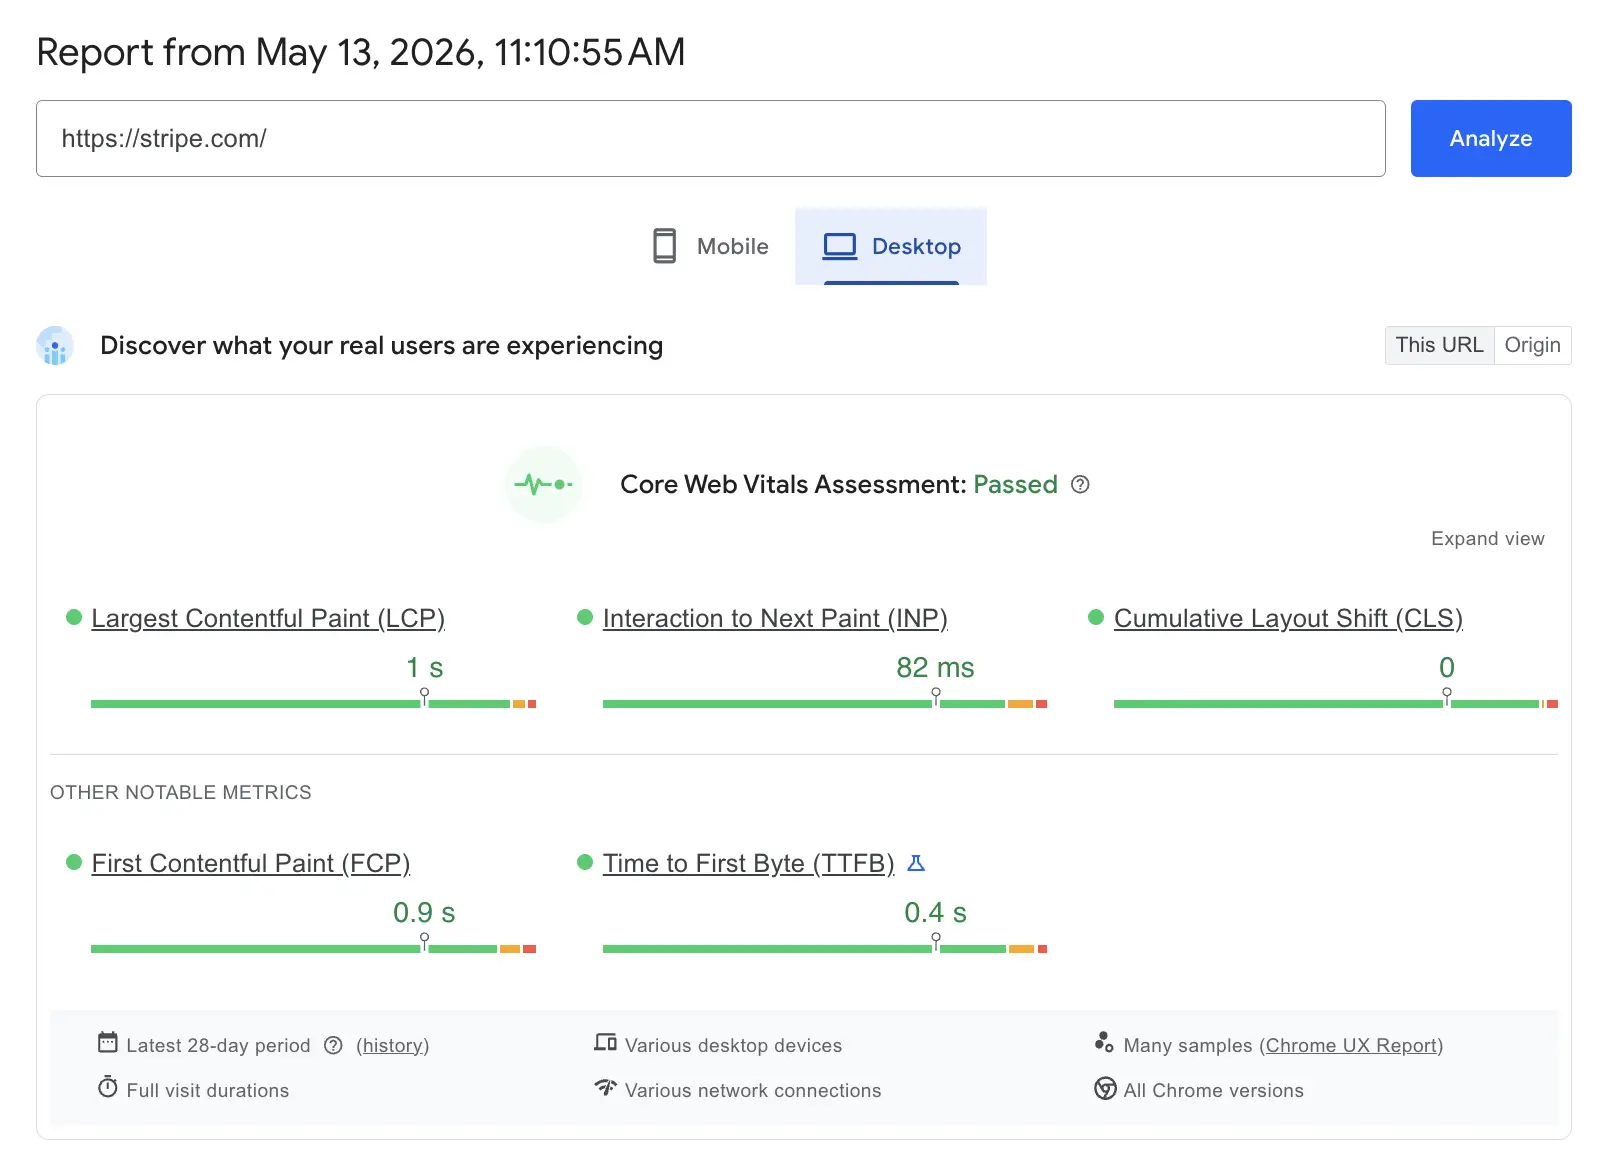
For the technical signals (LCP, INP, CLS, page load speed), Google publishes a free toolkit. PageSpeed Insights returns both lab and field data on demand. Search Console’s Core Web Vitals report surfaces aggregate field data over time. Lighthouse runs locally inside Chrome DevTools for ad-hoc audits before a release. All three pull from the same scoring rules documented on web.dev. This is the right tool category for metric 9 (Core Web Vitals) and metric 10 (page load speed).
Web analytics for traffic and engagement
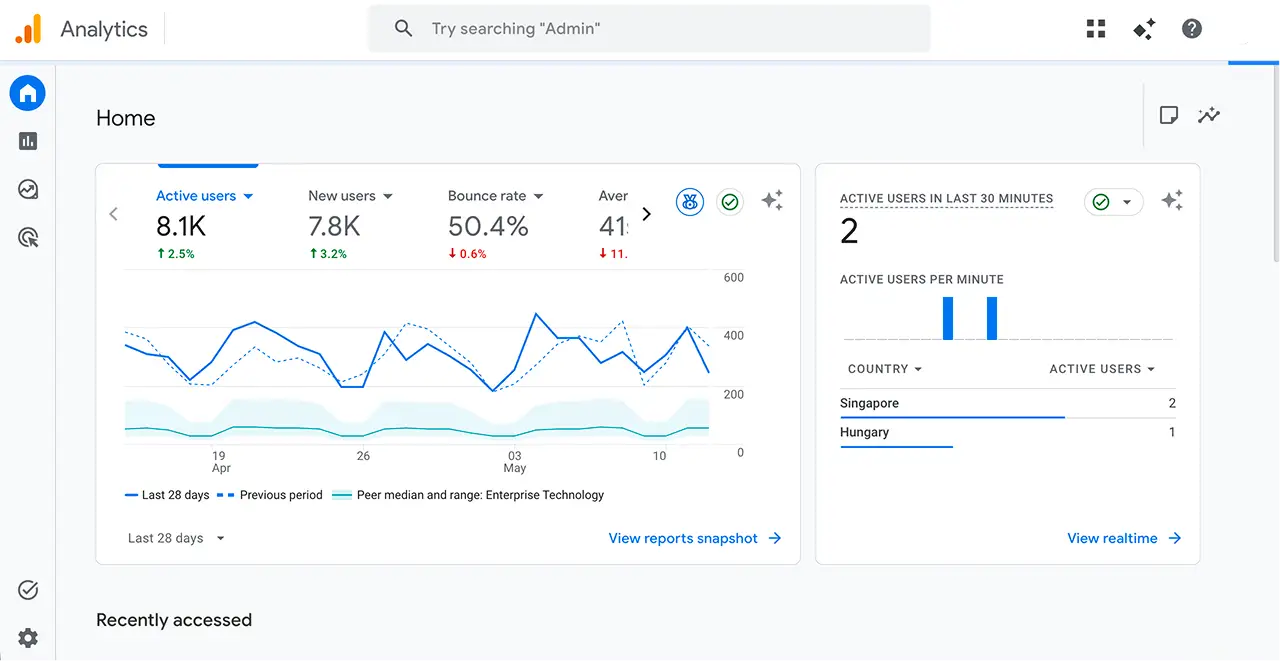
For total visits, unique visitors, pages per session, average session duration, bounce rate, and traffic source breakdown, a standalone web analytics platform is the standard fit. Google Analytics 4 is the common default. Tie analytics back to your commerce dashboards using the same customer ID or order ID, so you can follow a traffic source through to a paid order without rebuilding attribution. This is the right tool category for metrics 1, 2, 3, 4, and 8.
Real user monitoring (RUM)
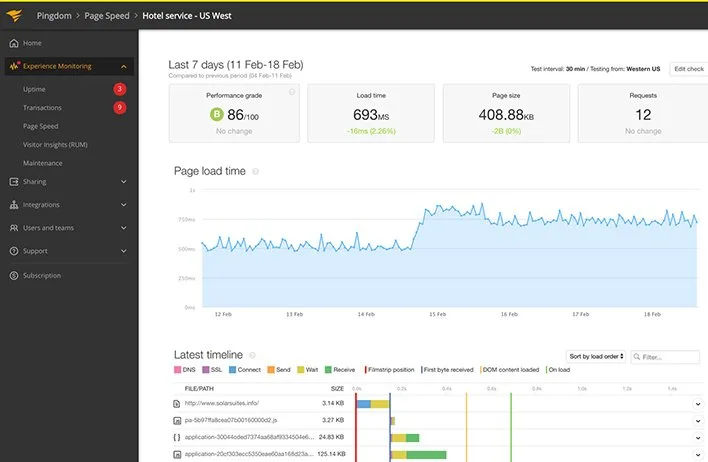
Lab tests miss the conditions real shoppers see. Real user monitoring tools collect performance data from real sessions, segmented by device, geography, browser, and connection type. RUM is what tells you whether the LCP improvement you saw on your laptop translates to the mobile shoppers Google scores you on. Use a RUM tool to validate that Core Web Vitals data from Google’s tools matches what your traffic mix experiences.
Performance testing platforms
For load, stress, spike, and scalability testing, the right tool simulates real browser sessions across devices, rather than raw HTTP requests alone. Platforms like TestGrid run automated performance tests, track CPU, memory, network use, and UI responsiveness during live test sessions, and cover real browsers across Safari, Chrome, Firefox, Opera, and Samsung Internet. Choose a platform that lets you reproduce flash-sale traffic patterns, not only steady-state load. This is the right tool category for the testing section below.
What is eCommerce website performance testing?
Ecommerce website performance testing is the practice of putting your store under simulated load to see how it behaves before real shoppers do. The aim is to confirm that product search returns fast, carts update accurately, payment gateways respond, and checkout completes when many shoppers are active at once. It is non-functional testing, so the store still works during the test, but the question becomes how well, under how much pressure.
Load testing
Load testing simulates an expected peak (a normal Black Friday hour, for example) and watches response times, error rates, and resource use. The store should hold steady response times across product search, cart, and checkout for the full window of that load.
Stress testing
Stress testing pushes traffic past the expected peak until something fails. The output is two numbers: the breaking point, and the time to recover after that breaking point passes. Both numbers feed your capacity planning before a sale event.
Spike testing
Spike testing pumps traffic in a sudden burst, simulating a flash sale, an influencer drop, or a viral product page. The pass criterion is whether the core flows (product page, cart, payment) keep working through the spike without dropping sessions.
Scalability testing
Scalability testing checks whether the store can grow with demand instead of crashing into a ceiling. You vary load, data volume, and concurrent transactions to see how the system stretches across larger catalogs, bigger product variations, and longer sales events.
How to run eCommerce website performance testing
A repeatable process matters more than a fancy tool. The five steps below align tests with the user journeys that drive revenue.
Step 1. Map critical user journeys
Start with the flows that pay the bills: product search, add to cart, checkout, and payment processing. For each, note when traffic peaks (holiday sales, paid campaigns, product launches, festive cycles) so you know which patterns to model.
Step 2. Set performance benchmarks
Decide what acceptable looks like before you run a test. Common benchmarks: page load under 2.5 seconds at the 75th percentile, checkout API response under 500 ms, error rate under 1%, and checkout success rate above 98%. Tie the numbers to business outcomes, not lab ideals.
Step 3. Design realistic test scenarios
Mimic real shopper behavior. Include browsing time, filter usage, abandoned carts, coupon application, returning logins, and a mix of payment methods. A test that only fires “add to cart and pay” misses where real friction lives in the funnel.
Step 4. Run tests and read the output
Test product pages, cart, and payment confirmation together, not in isolation. Look for slow database queries, error spikes, dropped sessions, and latency at the payment gateway boundary. Most eCommerce website performance issues show up as patterns across journeys, not single failures.
Step 5. Monitor in production and retest
Performance regresses when code or infrastructure changes. Continuous monitoring on top of release-time tests catches regressions before they hit a sale weekend. Run baseline tests after every major release and before every campaign.
The four critical journeys to test first
If you only test four flows, test these. They are where most cart abandonment happens, and they map cleanly to the metrics in section three.
- Product search: result speed, filter responsiveness, sorting performance, and “no results” handling.
- Add to cart: accurate pricing, accurate quantities, session consistency across pages.
- Checkout: address entry, shipping selection, payment, and order confirmation.
- Payment processing: authorization speed, callback handling, webhook delivery, and retry behavior.
Each one is a sub-funnel inside the larger purchase funnel. A 400 ms hiccup on payment gateway response can produce more cart abandonment than a slow homepage ever will.
What slows eCommerce stores down
Stores rarely fail because of one big problem. They fail because small inefficiencies stack up across the page.
- Heavy, unoptimized images: the largest contributor to page weight, especially when not resized for mobile or served in modern formats.
- Poor eCommerce hosting and no CDN: slow server response, no geographic delivery, and latency spikes during traffic surges.
- Inefficient caching: repeated loading of the same assets, no browser-level or server-level caching.
- Too many third-party scripts: ads, trackers, chat widgets, and pop-ups stacking up before interaction is possible.
- Complex checkout: too many fields, multi-step friction, slow validation, redirects between steps.
- Layout instability: elements jumping while the page renders, which both hurts UX and pushes CLS over the line.
How to improve eCommerce website performance
Speed and reliability fixes compound. The list below maps directly to the metrics above, so you can audit a metric and pull a matching fix.
Image and asset optimization
Compress images to WebP or AVIF, serve responsive sizes based on viewport, and lazy-load anything below the fold without delaying the hero. This is the highest-return fix on most product pages.
CDN and edge delivery
Serve assets and HTML from the location closest to the shopper. A CDN cuts time to first byte for international traffic and absorbs surges during sales events.
Smart caching
Browser caching for repeat shoppers, server-side caching for fast first-load delivery, and full-page caching where the page does not change per shopper. Caching also reduces server stress under load tests.
Checkout simplification
Cut fields to the minimum needed for fulfillment. Turn on autofill, offer guest checkout, and reduce redirects between steps. A 0.8 second checkout (which is the target FluentCart is built around) exists because every redirect and every extra field gets removed.
Code and script discipline
Defer non-critical JavaScript, remove unused code, and audit third-party scripts on every release. Each script adds time to interactive.
Mobile-first build
Most online shopping traffic now arrives from mobile devices, on slower networks and smaller screens. Build the mobile experience first, then expand for desktop, instead of shrinking a desktop design down. Mobile networks punish heavy pages harder than fiber.
Where FluentCart fits in measuring and improving eCommerce performance
A self-hosted WordPress commerce plugin gives you direct access to the performance levers above without an extra integration layer. FluentCart was built around fast checkout (a 0.8 second target), 0% transaction fees, and a wide built-in feature set so stores need fewer add-ons to ship the basics.
What that means for measurement and eCommerce website performance work:
- Built-in analytics and reporting for conversion rate, refunds, customer LTV, and revenue, with the data sitting on your own server.
- Order heatmaps and detailed revenue reports in Pro for spotting which hours and which products move the most.
- A native REST API documentation, webhooks, and headless support so you can pipe events into your monitoring stack without extra plugins.
- Free coverage on a wide block and shortcode set for product, cart, and checkout, so page weight stays controllable.
If you sell digital products with license keys, subscriptions, or bundles, the licensing and subscription tools live inside the same plugin, which removes a common source of cross-plugin slowdown. You can install it from the WordPress plugin directory and start measuring within the same day.
For email and customer flows tied to performance (cart recovery, post-purchase, lifecycle messaging), pairing FluentCart with FluentCRM keeps the messaging on your own server too, which avoids the rate-limit and data-export problems that surface as stores scale.
Wrapping up
You now have the 10 eCommerce website performance metrics worth tracking, the tools that measure each one, the four eCommerce website performance testing types to run, the five-step process for running them, a list of what slows a store down, and a short list of fixes that move the numbers. Performance is not a one-off project. It is the thing your store either does or does not do every time a shopper opens a product page.
Pick three metrics from the list above and start measuring this week. Run a load test against the four critical user journeys before your next sales event. If you want a faster, simpler stack to measure all of this on, take a look at the FluentCart product page and download the optimization techniques resource on your way through.

Rasel leads the marketing function at FluentCart, driving both high-level strategy and ground-level execution across the product’s growth engine. He plays a central role in defining how FluentCart is positioned, how it enters the market, and how it evolves based on user behavior and feedback. His responsibilities span go-to-market planning, funnel architecture, conversion strategy, and narrative development. He works across teams to ensure that product decisions, marketing efforts, and customer experience stay tightly aligned.

Subscribe now
Related Articles and Topics
-

Best Free eCommerce Business Course Options
Five hand-picked eCommerce courses that are genuinely free, plus one faster way to learn that most people skip.
-

eCommerce Data Ownership: Why Your Customer Records Decide Who Survives 2026
Your store does not own its customers. Right now, today, in June 2026. And the platforms hosting your…
-

Best Products to Sell on World Cup 2026 + Build Your Store Fast
Discover the best products to sell on World Cup 2026, from fan apparel to drinkware, and how to…


Leave a Reply