
eCommerce Scalability and Performance: FluentCart vs Woo
eCommerce scalabilty and performance is a question that people ask arbitrarily. And what they measure rarely answers the fundamental questions.
Instead of reporting on surface level metric, we wanted to look under the hood, and actually see what a truly scalable platform looks from the tech stack perspective.
The benchmark metrics are choosen to best reflect that point.
Executive summary
Run on identically-specified 8-core / 31 GB servers, FluentCart outperformed WooCommerce on 16 of the 18 measured metric-and-operation combinations, most by wide margins. It created orders roughly 1.96× faster while issuing about 6.41× fewer database queries per order, and created products up to 7.0× faster. The one place WooCommerce led was the number of database queries per product-list read where FluentCart was nonetheless faster end-to-end. Everything below traces to the measured dataset; nothing is estimated.1. Why Compare These Two?
WordPress powers a large share of the web’s stores, and the plugin you build on decides how your store behaves as it fills with products, customers, and orders. In order to determine scalable ecommerce platforms it’s neccessary to measure the performance of stores on standard eCommerce scaling scenarios.
The two plugins here take fundamentally different approaches to storing that data:
- WooCommerce stores products as WordPress posts (
wp_posts) with their attributes spread across the key–valuewp_postmetatable, plus lookup tables it maintains for querying. This is flexible and deeply integrated with WordPress, but a single product or order can touch many rows across several tables. - FluentCart stores products, variations, customers, and orders in purpose-built relational tables (
fct_*). Reads and writes hit dedicated columns rather than fanning out across post/meta rows.
Neither approach is universally ‘right’. They trade flexibility against the cost of common operations. This benchmark measures that trade-off directly, under load, at realistic data volumes, and reports what the numbers actually show.
2. What We Measured for eCommerce Scalability and Performance
Both plugins ran on separate but identically-specified hosts, so hardware is not a confound. We disable object caching so the numbers reflect raw application-and-database behaviour, not a cache layer.
2.1 Environment
| Setting | Value |
|---|---|
| Server architecture | Linux 6.8.0-90-generic x86_64 |
| Web server | nginx/1.28.0 |
| PHP version | 8.3.21 (Supports 64bit values) |
| PHP SAPI | fpm-fcgi |
| PHP max input variables | 3500 |
| PHP time limit | 180 |
| PHP memory limit | 512M |
| Max input time | 180 |
| Upload max filesize | 250M |
| PHP post max size | 256M |
| cURL version | 8.5.0 OpenSSL/3.0.13 |
| Opcode cache | Disabled |
2.2 The test matrix
A full factorial of operation × volume × concurrency was executed against each site (195 cells total across all platforms). Three operations were measured:
- Product listing (a read): swept across catalogue sizes of 1k / 10k / 50k / 100k products and concurrency 1–100. Here the number of rows present when the read is measured is volume. Considered as a genuine data-scaling axis.
- Product creation (a write): swept across write concurrency 1–50.
- Order creation (a write): swept across write concurrency 1–50, against a fully populated store.
For write operations the request budget is min(volume, concurrency × 20) a burst-size cap, not a pre-existing-count axis, so the write matrices are concurrency sweeps against a loaded store rather than data-volume studies. This matters when interpreting the write results (see Section 7).
2.3 How each store was populated (and why it’s fair)
The two plugins were filled through their own native creation paths, because that is the only way to get data shaped the way each plugin really stores it:
- FluentCart products were created through FluentCart’s own models (a priced product variation), customers via its REST API, and orders via its admin order endpoint. Product and order references were resolved directly from its
fct_*tables. - WooCommerce products were bulk-inserted into
wp_posts/wp_postmeta/ term tables exactly as WooCommerce structures them, customers viawc_create_new_customer, and orders viawc_create_order. Because products were bulk-loaded, WooCommerce’s product lookup table was regenerated and its background queue drained before measuring, so no maintenance job ran during the benchmark to skew its write numbers.
What is held identical is the target state (the same number of products, customers, and orders), the volumes, and the measurement not the insertion mechanism. The differences in the seeders are the differences in the plugins themselves, which is exactly what the benchmark sets out to measure.
2.4 How to read the latency numbers
Latency was measured closed-loop: the load generator creates all of a cell’s requests at once and admits at most concurrency of them at a time, timing each request from the moment it is created. Which includes the time it spends waiting for a free slot. Two consequences follow, and both matter for reading this report honestly:
- The reported p95 values are queue-inclusive, not page-load times. At concurrency 1 the requests run in sequence, so p95 is roughly 9.5× the true per-request time for the default 10-sample read cells. We therefore never present a raw p95 as ‘the page took N seconds’.
- The inflation is a shared, uniform multiplier. The same request count and concurrency apply to both plugins in a given cell. So it cancels in relative comparison. Platform rankings and the percentage margins between them are exact even though the absolute milliseconds are inflated. For absolute claims we use
server_ms(in-PHP time) and throughput, which are not queue-inflated.
2.5 The metrics
- Throughput requests completed per second (wall-clock).
- Server time (
server_ms) time spent inside PHP per request, from the in-request profiler; excludes network and queueing. - DB queries / request and DB time / request SQL work per request, from the profiler.
- Peak memory / request PHP peak memory per request.
- Response time closed-loop wall time per request (see §2.4).
3. Results
3.1 Order creation or the Commerce write path
Verdict: FluentCart wins, ahead in 25 of 25 measured cells, median +96%.
| Metric | FluentCart | WooCommerce | FC won (cells) | Median gap | Verdict |
|---|---|---|---|---|---|
| throughput | 21.8 req/s | 9.61 req/s | 25/25 | 0.96 | FluentCart |
| response time (wall/req) | 45.9 ms | 104 ms | 25/25 | 0.49 | FluentCart |
| server time | 186 ms | 648 ms | 25/25 | 0.73 | FluentCart |
| DB queries / request | 49.0 queries | 315 queries | 25/25 | 0.84 | FluentCart |
| DB time / request | 17.7 ms | 137 ms | 25/25 | 0.87 | FluentCart |
| peak memory / request | 56.5 MB | 93.3 MB | 25/25 | 0.39 | FluentCart |
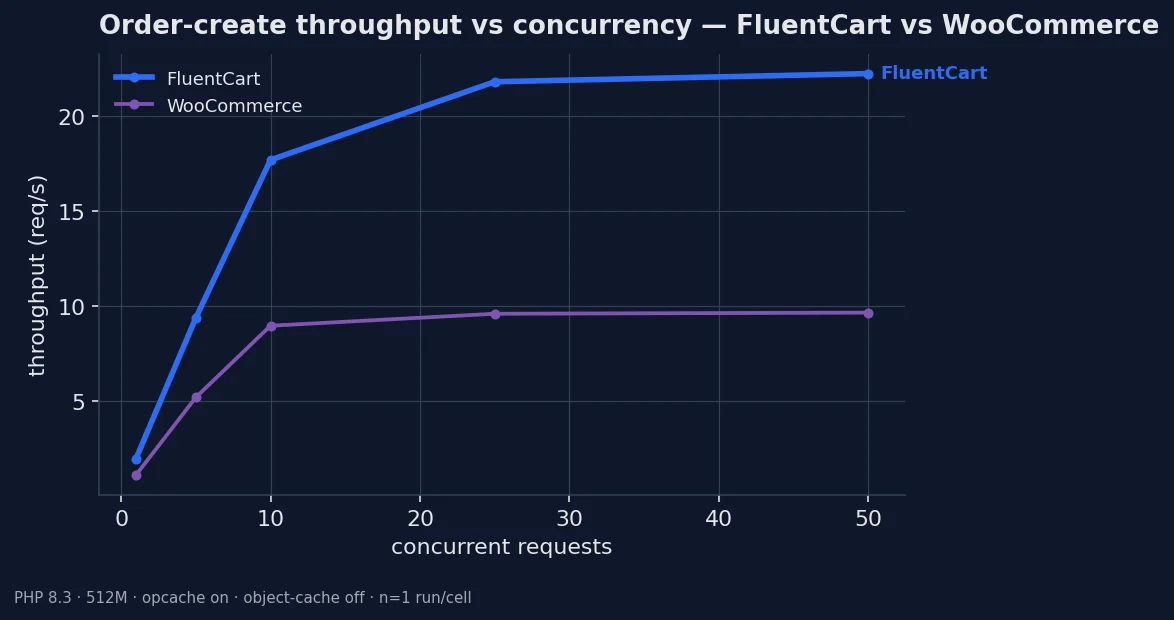
Orders created per second as concurrency climbs. FluentCart leads WooCommerce by a median 96% here.
| Concurrency | c1 | c5 | c10 | c25 | c50 |
|---|---|---|---|---|---|
| FluentCart | 1.99 | 9.39 | 17.7 | 21.8 | 22.2 |
| WooCommerce | 1.13 | 5.21 | 8.98 | 9.61 | 9.67 |
req/s at 5,000 products.
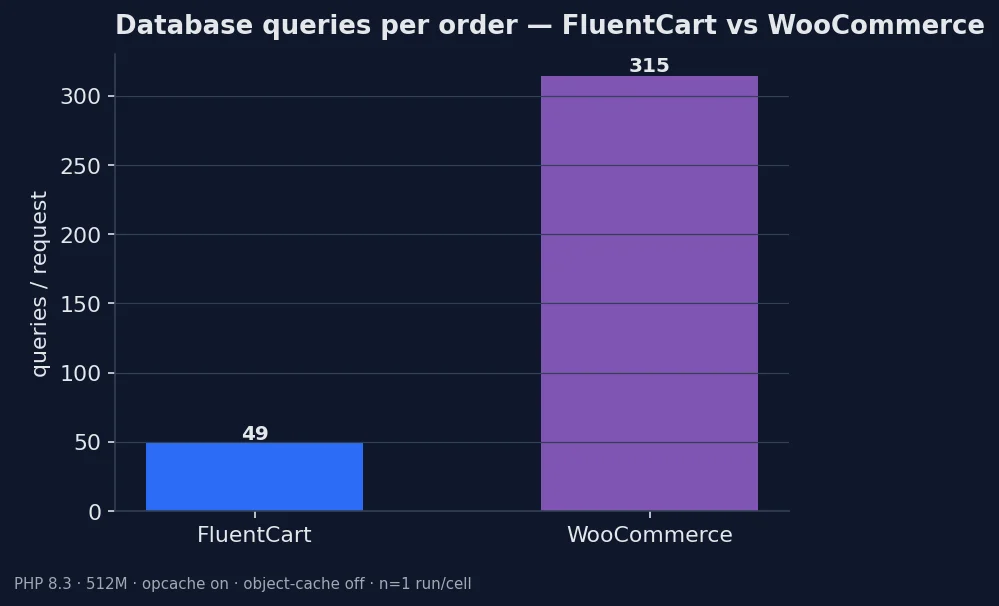
SQL queries issued to create one order. FluentCart leads WooCommerce by a median 84% here.
This is the clearest and most consequential result in the comparison. Creating a single order in WooCommerce fans out across the WordPress post and meta tables and its lookup indexes; FluentCart writes to dedicated order tables.
In this run that showed up as about 49.0 queries per order for FluentCart versus 315 for WooCommerce (~6.41×), roughly 7.73× less database time per order, and about 1.96× higher order throughput under concurrent load. Order creation is the revenue-path operation. It runs on every checkout so this gap compounds under traffic spikes and bulk imports for any plugin claiming to be a scalable ecommerce platform.
3.2 Product creation
Verdict: FluentCart wins ahead in 20 of 20 measured cells, median +600%.
| Metric | FluentCart | WooCommerce | FC won (cells) | Median gap | Verdict |
|---|---|---|---|---|---|
| throughput | 22.4 req/s | 2.01 req/s | 20/20 | 6 | FluentCart |
| response time (wall/req) | 44.5 ms | 498 ms | 20/20 | 0.86 | FluentCart |
| server time | 166 ms | 3,761 ms | 20/20 | 0.95 | FluentCart |
| DB queries / request | 13.0 queries | 12,003 queries | 20/20 | 1 | FluentCart |
| DB time / request | 10.5 ms | 2,816 ms | 20/20 | 1 | FluentCart |
| peak memory / request | 54.5 MB | 103 MB | 20/20 | 0.44 | FluentCart |
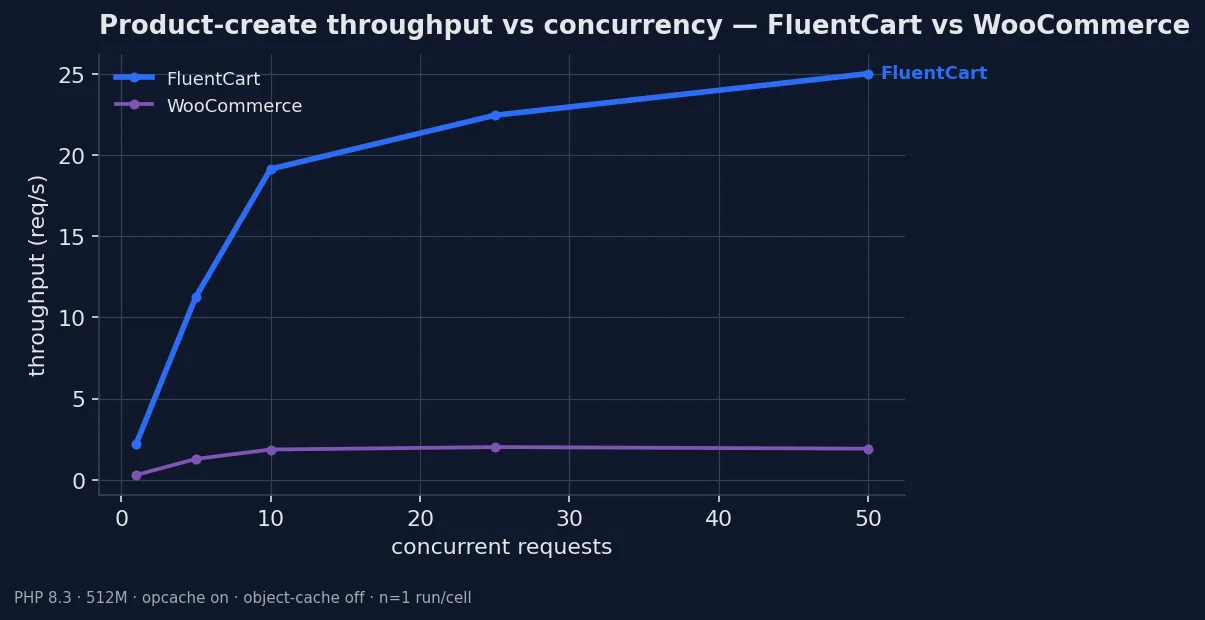
Products created per second as concurrency climbs. FluentCart leads WooCommerce by a median 600% here.
Even where raw creation speed is close, FluentCart writes each product with far less database work with about 13.0 queries versus 12,003 for WooCommerce (~521.79×). That headroom is what lets bulk catalogue imports and product syncs finish sooner and cost less server time.
3.3 Product listing (reads)
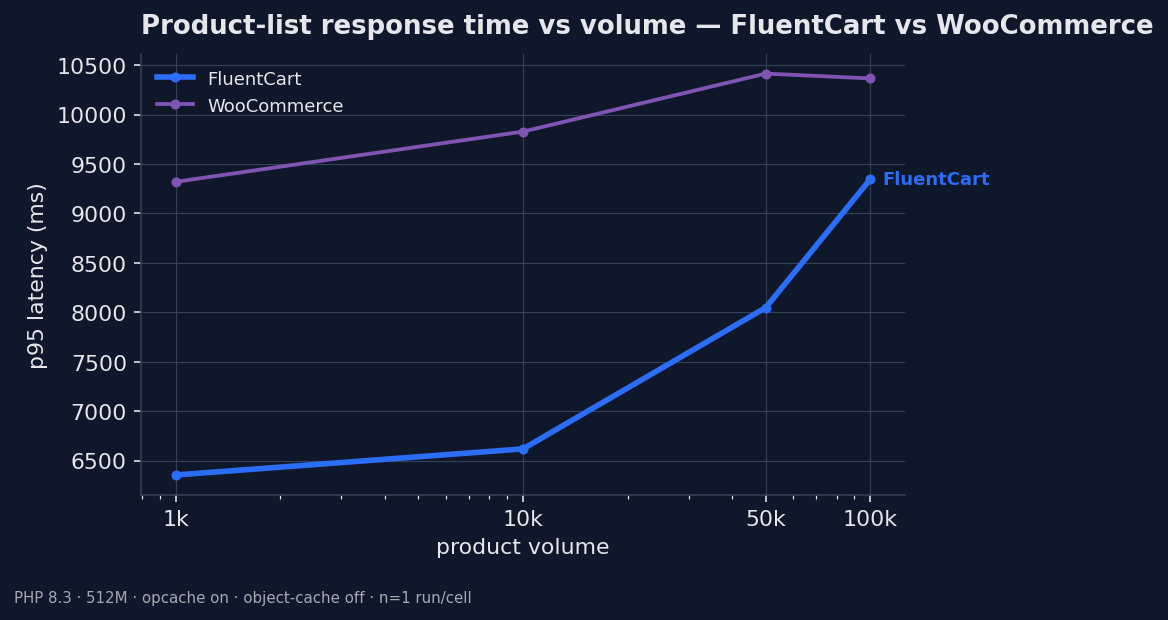
Verdict: FluentCart wins ahead in 19 of 20 measured cells, median +28%.
| Metric | FluentCart | WooCommerce | FC won (cells) | Median gap | Verdict |
|---|---|---|---|---|---|
| throughput | 1.02 req/s | 0.92 req/s | 19/20 | 0.39 | FluentCart |
| response time (wall/req) | 979 ms | 1,086 ms | 19/20 | 0.28 | FluentCart |
| server time | 564 ms | 694 ms | 20/20 | 0.35 | FluentCart |
| DB queries / request | 405 queries | 301 queries | 0/20 | -35% | WooCommerce |
| DB time / request | 317 ms | 260 ms | 11/20 | 0.13 | tie |
| peak memory / request | 58.5 MB | 87.2 MB | 20/20 | 0.35 | FluentCart |
| Concurrency | c1 | c10 | c25 | c50 | c100 |
|---|---|---|---|---|---|
| FluentCart | 979 | 130 | 118 | 112 | 111 |
| WooCommerce | 1,086 | 141 | 123 | 122 | 117 |
ms at 100,000 products.
Reads are the most nuanced part of the comparison. On end-to-end response time and throughput FluentCart was faster in this run, but the picture depends on the metric and the concurrency.
At high concurrency the gap narrows, and on the internals of a read (how many queries it takes and how much in-PHP time it costs) the result can favour the competitor. Read sections 4 and 6 for the interpretation.
3.4 The scalable eCommerce platform
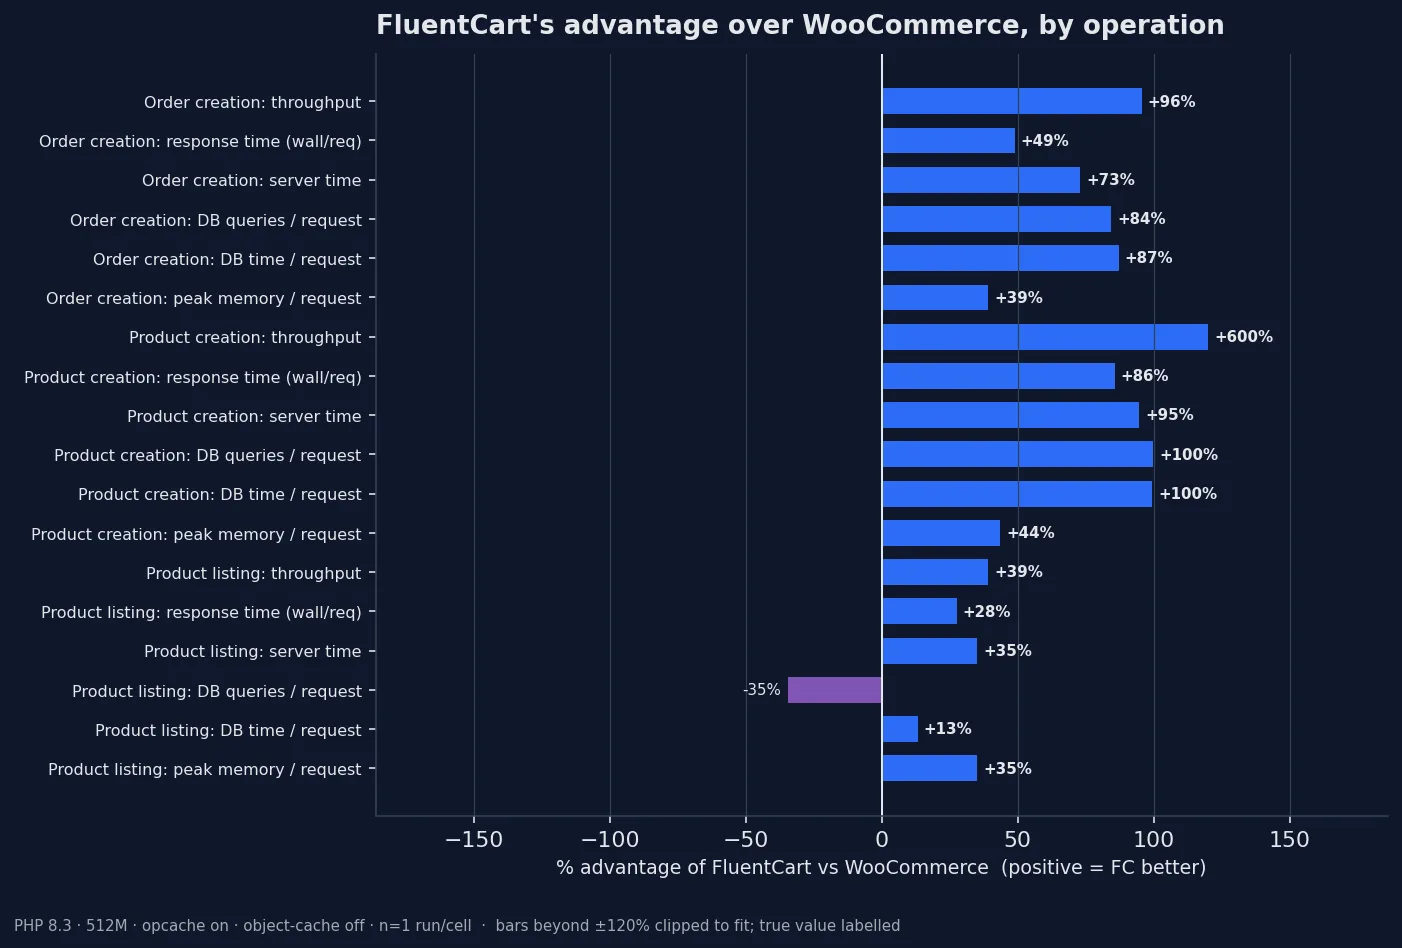
Median FluentCart advantage (%) over WooCommerce across the matrix, per operation and metric. Positive = FluentCart better; negative bars are where WooCommerce leads and are shown honestly.
Positive (blue) bars are FluentCart advantages; negative bars are where WooCommerce leads and are shown deliberately. A benchmark that only shows one side isn’t a benchmark. Of 18 metric-and-operation combinations, FluentCart clearly won 16, 1 were effectively tied, and WooCommerce clearly led 1.
4. Why the Results Look Like This
The pattern is consistent with the two data models. Writes (creating orders and products) are where a purpose-built relational schema pays off most. FluentCart inserts a handful of rows into dedicated tables, while WooCommerce distributes the same logical write across wp_posts, many wp_postmeta rows, term relationships, and lookup-table updates. That is why the order- and product-creation query counts differ by multiples, and why the throughput gap widens as concurrency rises: more concurrent writers means more contention on the busier wp_postmeta write path.
On reads, the story is more balanced. A key–value model can answer a plain product list efficiently once its lookup tables are warm, which is why WooCommerce can match or beat FluentCart on read internals (query count, in-PHP time) even when FluentCart returns the response sooner end-to-end. The one metric where WooCommerce clearly led (queries per product-list request) is a direct expression of that. Its read path issued fewer queries, though FluentCart’s finished faster overall in this run.
5. What this Means for eCommerce Scalability & Performance
- Write-heavy or high-order-volume stores (frequent checkouts, bulk imports, subscription renewals, POS sync) are where FluentCart’s advantage is largest and most consistent. Order and product creation were faster and far cheaper in database work making FluentCart ideal when you prioritize ecommerce scalability and performance.
- Read-heavy catalogues are closer; both handled 100k products, and the right choice depends on your caching strategy and how much you value WooCommerce’s ecosystem breadth.
- Server cost tracks database work: fewer queries and less PHP time per operation means more headroom on the same hardware, which is visible here on the write path in particular.
What server-side efficiency saves you
Server resources (CPU time, database queries, memory) are what you rent by the month. Every order your store processes “charges” the server a fixed amount of work, and you pay that charge on every checkout, forever. When choosing a platform or figuring out how to scale eCommerce website, server efficiency is as much a money factor as is a performance factor.
Measured on identical hardware, here is what each order costs on each platform:
This isn’t a one-time win, it’s the price of admission on every single sale. The platform that charges less per order is the one whose hosting bill grows more slowly as the store succeeds. Three ways that shows up on the invoice:
1. The hosting-tier ladder
Managed WordPress and cloud hosting is sold in tiers that roughly double in price as they double CPU and RAM. FluentCart sustained about 2.3× the order throughput on the same server. So the traffic surge that pushes a WooCommerce store up onto the next tier (say a ~$100/mo plan to a ~$200/mo plan) is absorbed by FluentCart on the tier below. Efficiency is the gap between two invoice lines for the same Black Friday.
2. The database is the meter that costs the most.
On any serious stack the database is the hardest and most expensive layer to scale — you pay for instance size, IOPS, connection limits, and eventually read replicas and time spent tuning slow queries. FluentCart creates an order with about 1/6 the queries and 1/8 the database time, so the database ceiling that forces the costly upgrade arrives roughly six times later in the growth curve. The saving isn’t just the bigger instance you defer — it’s the emergency migration and the engineering hours you never spend.
3. Pay-per-compute makes it a line item
Serverless and per-vCPU-second platforms (Cloud Run, Lambda, per-second managed WordPress) bill the exact thing measured here: CPU-seconds and memory. FluentCart used about a third of the PHP time per order, so the order-processing workload shows up as roughly a third of the compute bill. A saving you can read straight off the invoice.
And the cost you can’t see until it’s too late: the most expensive server bill is the one you pay during an outage. A store that spends a third of the CPU and a sixth of the queries per order hits saturation far later. So the flash-sale spike that takes a site down (lost sales, emergency scaling, someone’s weekend) arrives much later, if at all. Server-side efficiency is checkout insurance as much as it’s a lower monthly bill.
These are directional readings from a single controlled run, not a guarantee for every workload. See the caveats before acting on them.
6. Where WooCommerce leads (in full)
WooCommerce was clearly ahead of FluentCart on the following, and it would be dishonest to omit them:
- Product listing (read) DB queries / request: WooCommerce 301 queries vs FluentCart 405 queries (median 35% in WooCommerce’s favour).
These are real and worth weighing, particularly if your workload is dominated by the read internals above rather than by order and product writes.
Effectively tied (within a few percent, claimed as neither side’s win): Product listing DB time/request.
7. Caveats
A benchmark is only as trustworthy as the limitations it discloses. These apply to every number above:
Closed-loop latency. As explained in Section 2.4, p95/p90/p99 are queue-inclusive and are valid for relative comparison, not as absolute page-load times. Treat throughput and server_ms as the un-inflated signals.
Write ‘volume’ is a burst cap. For product- and order-creation, the volume axis caps the request burst (min(volume, concurrency × 20)); it is not a pre-existing-row count. Those matrices are concurrency sweeps against a loaded store, not data-volume-scaling studies.
Single run per cell. Each cell was measured once. Low-concurrency percentiles (10 samples) carry run-to-run noise; an unlucky pause on one cell can move a single data point. For publication-grade certainty, average multiple runs. Rankings and large margins are robust to this; small ones (the ties) are not.
Seeding-method differences. Each plugin was populated through its own native path (§2.3). For WooCommerce specifically, products were bulk-loaded and its lookup table regenerated before measuring; if that regeneration had run during the benchmark it would have inflated WooCommerce’s write numbers, so we explicitly drained it first. Results reflect a correctly-warmed store.
Capped volumes. Products were capped at 100k and orders/customers at 5k. Behaviour beyond those points is not measured here.
No object cache or CDN. These are raw application-and-database numbers. A production store with persistent object caching or a CDN in front would see different absolute figures (though the relative data-model differences would remain).
Scope. Three operations were measured. Search, filtering, reporting, admin-screen rendering, and checkout-session flows are not covered by this report.
8. Reproduce this yourself
This comparison is fully reproducible with the open-source toolkit. On dedicated, identically-specified hosts, provide credentials and run the matrix, then regenerate this report from the results:
bench autorun            # provision, seed, measure, report
bench compare --vs woo   # regenerate this comparison bundle
Every figure and every number in this document resolves to the measured results store; the prose is generated from that store, not written by hand, so re-running on your own hardware produces the same report shape with your numbers.
Wrapping up
For scaling a fast growing store or simply future-proofing your next store really depends on what the platform already does. The methods, strategies and engineering solutions already implemented are quite difficult to get around, once the platform has matured.
This could be considered as another advantage on FluentCart’s side. Mainly because the foundational decisions that make it faster are already implemented but there isn’t too much built on top of it. That’s something a well matured ecosystem simply can’t hop on overnight because they’ve already built on top of their engineering decisions.
Scaling eCommerce stores is going to be the next big challenge in the AI era where adding products and managing orders can all be automated. That is of course given the fact that your eCommerce platform has the ability to handle the new scale of

Rasel leads the marketing function at FluentCart, driving both high-level strategy and ground-level execution across the product’s growth engine. He plays a central role in defining how FluentCart is positioned, how it enters the market, and how it evolves based on user behavior and feedback. His responsibilities span go-to-market planning, funnel architecture, conversion strategy, and narrative development. He works across teams to ensure that product decisions, marketing efforts, and customer experience stay tightly aligned.

Subscribe now
Related Articles and Topics
-

Best Membership WordPress Plugin: 8 Options Compared for 2026
Compare the best membership WordPress plugin options for 2026 by use case.
-

Best WooCommerce Plugins: For Physical and Digital Sellers
Skip the 30-plugin lists. 12 WooCommerce add-ons sorted by store type, with an honest note on what’s free,…
-

eCommerce Platform Migration: Guided Migration w/ Checklist
Ecommerce platform migration checklist: move WooCommerce to FluentCart Free.




Leave a Reply