eCommerce KPIs: Metrics That Fuel Online Store Growth

Running an e-commerce business is a balancing act between growth and grit, traffic and trust, creativity and conversion. Here, only data can keep you on course. Intuition can be really expensive and get you a long way.
Key Performance Indicators (KPIs) are the only dependables in this regard. Consider them the GPS of your company, showing you where you’re succeeding, where you’re faltering, and where you need to go next.
In order to help you make better decisions more quickly, we’ve broken down over 50 truly most important eCommerce KPIs.
The correct KPIs will guide you whether your goal is to increase sales, reduce acquisition costs, or retain customers. Let’s get started and turn your numbers to your advantage.
What Is a Key Performance Indicator (KPI)?
KPI, or Key Performance Indicators, are measurable metrics of performance over time toward a particular goal. KPIs give teams goals to strive for, benchmarks to measure advancement, and information that helps individuals throughout the company make better choices.
These indicators support the strategic advancement of every department within the company, from marketing and sales to finance and HR.
KPIs are particularly effective in eCommerce. They help a business understand what’s driving growth, what needs improvement, and where to focus next by transforming raw data into clear direction.
You can get a real-time picture of your store’s performance with metrics like conversion rate, average order value, and customer acquisition cost. Staying focused, agile, and competitive in today’s eCommerce landscape, choosing the right KPIs is the key.
Why Are KPIs Crucial for eCommerce Success?
In eCommerce, intuition has its place, but when it comes to sustainable growth, data is your real advantage. KPIs bring clarity by turning day-to-day activity into measurable progress.
Here’s how the right metrics make a big impact:
Strategic Decision-Making: KPIs give you a clear view of what drives results. For instance, if your conversion rate jumps after a homepage redesign, you’re no longer guessing. You know what’s working and why.
Team Alignment: When your team operates from the same set of metrics, everyone moves in sync. Whether it’s tracking daily sales, bounce rate, or customer satisfaction, shared numbers create shared goals.
Early Problem Detection: Say your cart abandonment rate suddenly spikes. With KPIs in place, you catch the issue quickly, before it affects your bottom line. It could be a broken checkout button, unexpected fees, or slow load times. KPIs point you directly to the problem.
Measuring ROI: Not all efforts pay off equally. KPIs let you compare the cost of your marketing campaigns, tools, or partnerships against what they actually deliver. If your customer acquisition cost is climbing but LTV isn’t, you know it’s time to rethink the approach.
60+ Key Performance Indicators of a Successful Business
eCommerce success isn’t driven by one metric alone. It’s the result of many moving parts working together. That’s why KPIs are grouped into key categories, each offering insight into a different area of your business.
The five main KPI categories are:
- Sales KPIs: Revenue, conversion, and transaction metrics
- Marketing KPIs: Traffic, engagement, and campaign performance
- Customer Service KPIs: Support efficiency and satisfaction metrics
- Manufacturing KPIs: Production and supply chain performance
- Project Management KPIs: Team performance and resource utilization
| KPI Category | KPI | What It Measures | Verified Benchmark / Notes |
|---|---|---|---|
| Sales KPIs | Conversion Rate | % of visitors who make a purchase | 2.5–3% avg; F&B: ~6% |
| Sales KPIs | Average Order Value (AOV) | Revenue per order | $144.57 avg; Fashion: ~$82 |
| Sales KPIs | Customer Acquisition Cost (CAC) | Cost to acquire a new customer | $50–$130 avg; Target CLV:CAC = 3:1 |
| Sales KPIs | Customer Lifetime Value (CLV) | Value a customer brings over time | Higher is better; guides acquisition strategy |
| Sales KPIs | Sales Volume | Total number of orders | Tracks order growth over time |
| Sales KPIs | Gross Profit Margin | Profit after cost of goods sold | 15%–45% healthy range |
| Sales KPIs | Customer Retention Rate | % of returning customers | 5% ↑ = up to 95% profit ↑ |
| Sales KPIs | Cart Abandonment Rate | % of carts not completed | Average is 70.19% |
| Sales KPIs | Revenue per Visitor (RPV) | Revenue generated per visitor | Evaluates traffic quality |
| Sales KPIs | Repeat Purchase Rate | % of customers who return | Measures loyalty |
| Sales KPIs | Order Frequency | Avg. purchases per customer | Higher indicates strong retention |
| Sales KPIs | Refund & Return Rate | % of orders returned | Lower rate = better CX and profit |
| Sales KPIs | Discount Redemption Rate | % of users applying coupon codes | Assesses promo effectiveness |
| Sales KPIs | Upsell/Cross-sell Rate | % of orders with add-on items | Drives higher AOV |
| Sales KPIs | Sell-through Rate | % of inventory sold within period | Avoids overstock and markdowns |
| Marketing KPIs | Website Traffic | Number of visits to your store | 40–60% from organic is ideal |
| Marketing KPIs | Bounce Rate | % of visitors who leave after one page | 26–70% depending on niche |
| Marketing KPIs | Time on Site | Avg. session duration | 2–4 minutes typical |
| Marketing KPIs | Email Open Rate | Email engagement | 21%–25% avg in ecommerce |
| Marketing KPIs | Email CTR (Click-through Rate) | Click engagement in emails | 2.5%–3.5% avg; higher with segmentation |
| Marketing KPIs | Social Media Engagement | Likes, comments, shares etc. | IG: 1–3%, FB: 0.5–1% |
| Marketing KPIs | ROAS (Return on Ad Spend) | Revenue generated per $ ad spend | 4:1 or higher is ideal |
| Marketing KPIs | CPC (Cost per Click) | Cost per ad click | Google: $1–2, FB: $0.50–1.50 |
| Marketing KPIs | PPC Quality Score | Ad relevance & performance | Target 7–10 for better ad placement |
| Marketing KPIs | Organic Traffic Share | % of traffic from search | Supports SEO success |
| Marketing KPIs | Branded vs. Non-Branded Traffic | Type of keyword traffic | Indicates brand demand |
| Marketing KPIs | CPA (Cost per Acquisition) | Marketing cost per customer | Complements CAC |
| Marketing KPIs | Customer Engagement Rate | Activity across marketing channels | Higher rate = stronger connection |
| Marketing KPIs | Video View-through Rate | % who watch full video ads | Indicates ad hook performance |
| Marketing KPIs | Influencer ROI | Return generated per influencer spend | Benchmark varies by channel |
| Marketing KPIs | Affiliate Conversion Rate | % of affiliate traffic converting | Measures affiliate program value |
| Customer Service KPIs | First Response Time | Time to respond to customer queries | Ideal: under 4 hours |
| Customer Service KPIs | Average Resolution Time | Time to fully resolve a ticket | Email: 12–48 hrs, Chat: 2–5 mins |
| Customer Service KPIs | CSAT (Customer Satisfaction Score) | Post-support customer satisfaction | Strong score: 75%–85% |
| Customer Service KPIs | NPS (Net Promoter Score) | Customer loyalty & likelihood to refer | 50+ = excellent |
| Customer Service KPIs | Ticket Volume Trends | Support load over time | Useful for staffing & forecasting |
| Customer Service KPIs | Escalation Rate | % of tickets needing escalation | Should stay below 10% |
| Customer Service KPIs | CES (Customer Effort Score) | Ease of resolution experience | Lower = more efficient support |
| Customer Service KPIs | Self-Service Resolution Rate | % of issues resolved by FAQ/chatbot | Higher rate = better automation |
| Customer Service KPIs | Churn Rate | % of customers lost over time | Lower is better for profitability |
| Customer Service KPIs | Complaint Volume | Number of complaints received | Indicates customer experience pain points |
| Operations KPIs | Cycle Time | Time from order to delivery | 1–3 days for ecommerce leaders |
| Operations KPIs | First Time Yield (FTY) | Orders fulfilled without needing rework | Target: 95%+ |
| Operations KPIs | Overall Equipment Effectiveness (OEE) | Efficiency of production systems | 85% = world-class |
| Operations KPIs | Inventory Turnover | Times inventory is sold/replaced | 4–6 turns/year is healthy |
| Operations KPIs | Stockout Rate | % of time items are out of stock | Keep under 5% |
| Operations KPIs | Backorder Rate | % of delayed or unfulfilled orders | Use as reliability indicator |
| Operations KPIs | Order Accuracy Rate | % of orders delivered correctly | 99%+ ideal |
| Operations KPIs | On-time Delivery Rate | % of orders delivered on schedule | Aim for 95%+ |
| Operations KPIs | Warehouse Picking Accuracy | Accuracy in item selection from storage | Target 99%+ |
| Operations KPIs | Fulfillment Cost per Order | All costs per order shipped | Lower = higher profitability |
| Project & Finance KPIs | Budget Variance | Difference from budgeted cost | Stay within ±10% |
| Project & Finance KPIs | ROI per Project | Return on investment in projects | 3–5x for marketing projects is ideal |
| Project & Finance KPIs | CPI (Cost Performance Index) | Cost efficiency of a project | >1.0 means under budget |
| Project & Finance KPIs | Time to Completion | How long a project takes | Shorter = more efficient |
| Project & Finance KPIs | Resource Utilization Rate | % of resources used effectively | Avoid under- or over-utilization |
| Project & Finance KPIs | Break-even Point | Revenue required to cover costs | Essential financial milestone |
| Project & Finance KPIs | Cash Flow Forecast Accuracy | Accuracy of financial predictions | Aim for >90% forecasting accuracy |
| Project & Finance KPIs | Gross Merchandise Value (GMV) | Total value of all sales processed | Key in marketplaces & scale models |
| Project & Finance KPIs | Monthly Recurring Revenue (MRR) | Monthly subscription income | Vital for SaaS & subscriptions |
| Project & Finance KPIs | Annual Recurring Revenue (ARR) | Predictable yearly revenue | MRR × 12 |
| Project & Finance KPIs | Revenue Growth Rate | % increase in revenue over time | Higher = good business health |
Sales KPIs: The Revenue Drivers
The core of every eCommerce strategy is the sales KPIs. They show how well you’re converting visitors, how much they’re spending, and how efficiently you’re growing revenue.
Start with your conversion rate, the percentage of visitors who make a purchase. The 2024 average is 1.58%, though high-performing niches like food and beverage reach over 7%. Even small improvements here can have a big impact on your bottom line.
Next is average order value (AOV), currently around $145 across eCommerce. Increasing it through bundling or free shipping thresholds can boost revenue without increasing traffic.
Customer acquisition cost (CAC) tells you how much you’re spending to win new customers. The goal is to keep CAC low and customer lifetime value (CLV) high, ideally with a 3:1 ratio or better.
Other key metrics include sales volume, gross profit margin, and customer retention. Even a small increase in retention can lead to a major lift in profitability.
On the flip side, keeping an eye on your cart abandonment rate, an industry average of 70–75%, can help recover lost sales with smart fixes like transparent shipping costs.
Marketing KPIs: Driving Traffic and Engagement
Marketing KPIs help you understand how well your efforts are attracting, engaging, and converting your audience. It’s not just about getting people to your site. It’s about getting the right people, keeping them there, and leading them toward a purchase.
Start with website traffic. Tracking your total visits, unique visitors, and traffic sources helps you see exactly where your audience is coming from. Top-performing eCommerce stores often see 40–60% of their traffic from organic search alone.
Metrics like bounce rate and time on site tell the story of what happens next. A bounce rate between 35–45% is common in fashion eCommerce, while session duration averages 2 to 4 minutes. The longer people stay, the more likely they are to convert.
Email marketing remains a powerhouse, but only if your message lands. Open rates of 21–25% are standard in retail, and small tweaks like personalized subject lines can boost performance significantly.
Effective segmentation also leads to higher click-through rates, bringing more qualified traffic back to your store.
Social media KPIs focus on engagement, not just followers. A 1–3% engagement rate on Instagram is strong, while Facebook typically sees lower averages. These numbers help shape your content strategy and reveal how invested your audience really is.
Paid campaigns need their own set of metrics. ROAS (Return on Ad Spend) is key. A 4:1 ratio is generally considered profitable. Combine this with CPC and Quality Scores, and you’ll have a clear picture of your ad efficiency across platforms like Google and Facebook.
With the right marketing KPIs in place, it becomes easy to stop guessing and start optimizing, making sure every channel pulls its weight.
Customer Service KPIs: Building Satisfaction and Loyalty
Customer service isn’t just a support function. It’s a growth engine. Great service builds loyalty, drives repeat business, and powers word-of-mouth referrals. The right KPIs help you keep a pulse on how well you’re delivering that promise.
Response time is often the first make-or-break moment. Most customers expect a reply within a few hours. Make them wait too long, even just beyond 24 hours, and satisfaction drops fast. Platforms like live chat and well-designed FAQs can help reduce wait time.
On that note, resolution time is just as important. Whether it’s email, chat, or phone, the quicker and smoother the resolution, the happier your customer. Brands known for quick, helpful service. Like Zappos, it consistently scores 90%+ in customer satisfaction (CSAT).
Net Promoter Score (NPS), which measures how likely customers are to recommend your brand, is another crucial metric. A score over 50 is excellent, with top brands like Apple and Amazon hovering between 50 and 70.
Finally, tracking support volumes, trend shifts, and escalation rates will uncover recurring issues and training gaps. For example, a sudden spike in tickets after a product launch may signal a disconnect between marketing and customer expectations.
When service is seamless and proactive, customers feel seen, and that’s what keeps them coming back.
Manufacturing & Operations KPIs: Powering Fulfillment
For eCommerce stores that manage their own products and supply chains, manufacturing and operations KPIs ensure the behind-the-scenes work is reliable, fast, and cost-effective.
One of the most important metrics is cycle time, how long it takes to fulfill an order. Today’s customers expect fast delivery, and benchmarks of 1–3 days are common for competitive brands.
Inventory health also plays a huge role. KPIs like turnover rate show how efficiently stock is moving, while stockout rates measure how often products are unavailable. The sweet spot is balancing enough inventory to meet demand without tying up too much capital.
First Time Yield (FTY) and Overall Equipment Effectiveness (OEE) are key for those handling in-house production or custom products. Hitting a 95%+ yield rate means most orders are shipping without rework or waste, a sign of lean, scalable systems.
Ultimately, strong operational KPIs support fast, accurate, and customer-friendly fulfillment — laying the groundwork for a trustworthy brand experience.
Project Management KPIs: Fueling Internal Performance
Behind every product, campaign, or customer experience is a team making it happen. Project management KPIs track how well your teams are planning, executing, and delivering results — all while staying on time and budget.
Budget variance shows how close you are to hitting financial targets. Ideally, project costs stay within 10% of what was planned. If not, it’s a signal to reassess scope, resources, or timelines.
Return on investment (ROI) offers a clear look at whether a project actually paid off. In eCommerce, marketing-related projects often aim for 3–5x returns, especially for product launches or seasonal campaigns.
Meanwhile, tools like the Cost Performance Index (CPI) help you gauge overall efficiency. A CPI greater than 1.0 means you’re getting more value out of your spending — a sign your processes and teams are well-optimized.
Resource utilization and on-time delivery rates also matter. These KPIs help you avoid burnout, prevent bottlenecks, and keep your operations moving at the pace your growth demands.
Effective project management KPIs turn internal action into external outcomes, ensuring that your vision scales alongside your team.
Creating Effective eCommerce KPI Templates
eCommerce KPI templates help turn business goals into tangible, trackable actions. Whether you’re launching a new product, cutting acquisition costs, or improving loyalty, a well-structured KPI framework keeps your team aligned and focused.
Here are three battle-tested templates with real-world inspiration to help you build your own.
Template 1: Boost Sales by 10% in Q1
To increase revenue, focus on KPIs that drive transactions and shopping behavior.
Primary KPIs:
- Daily and weekly sales tracking
- Conversion rate optimization
- Average order value (AOV) improvement
- Website traffic volume
Example: ASOS grew sales by 15% in a single quarter by optimizing mobile conversions and using personalized product recommendations.

Template 2: Reduce CAC by 20% in 6 Months
Customer acquisition can quickly drain the budget without the right performance metrics in place. Home in on acquisition efficiency by channel.
Primary KPIs:
- Customer acquisition cost (CAC) by source
- Organic traffic growth
- Email subscriber conversion rate
- Referral program success
Template 3: Improve Customer Retention by 25%
Retaining customers is more cost-effective than acquiring new ones. These KPIs help strengthen brand loyalty and long-term relationships.
Primary KPIs:
- Repeat purchase rate
- Customer lifetime value (CLV)
- Email engagement (open and click-through)
- Customer satisfaction (CSAT and NPS)
Example: Glossier reached 90%+ customer retention rates through community-building and hyper-personalized customer engagement.

Streamlined KPI Tracking with FluentCart
These KPI templates work across different industries and business models. Whether you’re running an eCommerce business with digital or physical products, tracking these metrics is crucial for success, and FluentCart makes it easier than ever.
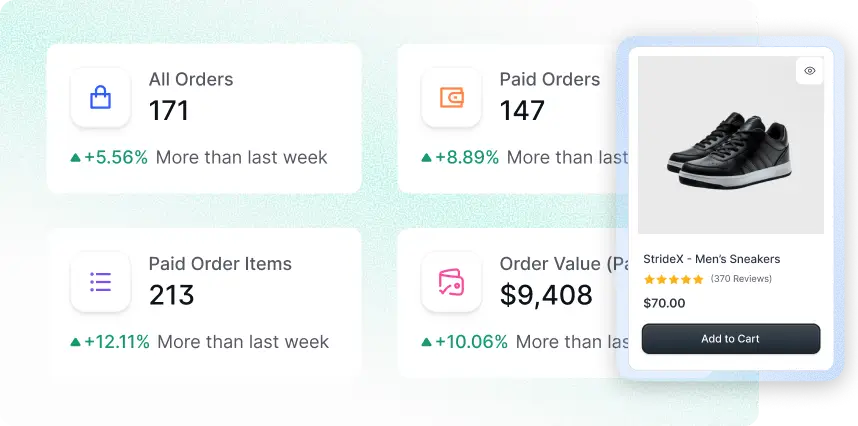
For example, comprehensive KPI tracking becomes seamless through built-in reports and analytics dashboards. You can monitor essential metrics, including:
- Net Revenue and Gross Sales tracking
- Orders and Items volume analysis
- Average Order Net and Average Order Gross calculations
- Average Order Items per transaction
- Plus, virtually all the eCommerce KPIs covered in this guide
…. And almost everything
See FluentCart Report & Analysis →
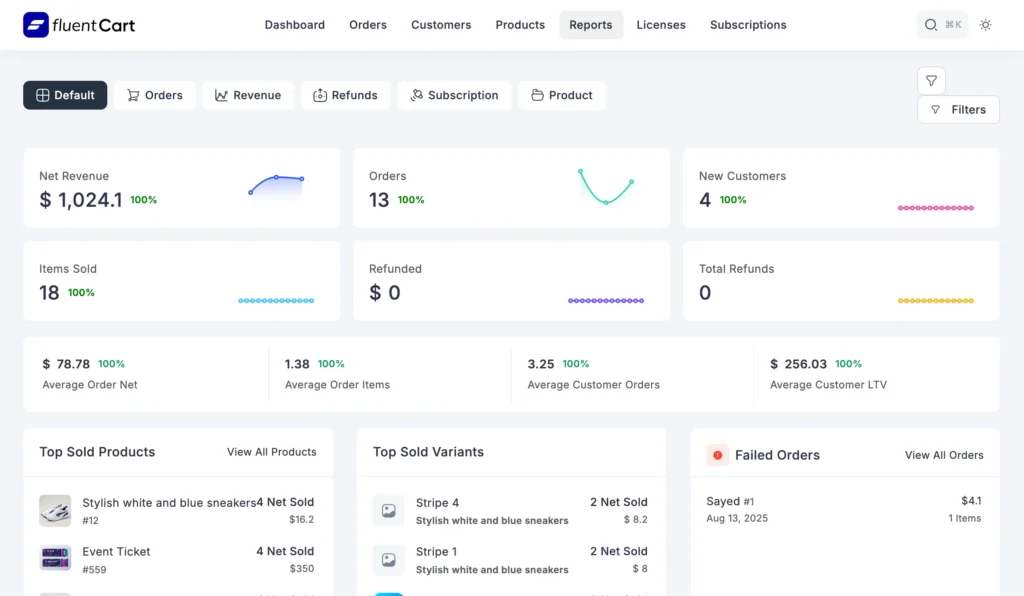
FluentCart offers an all-in-one solution for report analysis, eliminating the need to calculate or track metrics across multiple tools manually. This integrated approach saves time and ensures accuracy in your KPI monitoring.
KPI Implementation Best Practices
Setting Up Your Dashboard
- Choose 3-5 Primary KPIs per business goal
- Set Realistic Benchmarks based on industry standards
- Review Weekly for operational KPIs
- Analyze monthly for strategic KPIs
- Adjust Quarterly based on performance trends
| Mistakes to Avoid | Making KPIs Actionable |
|---|---|
Frequently Asked Questions
- How is eCommerce performance measured?
eCommerce performance is measured using a combination of sales, marketing, and operational KPIs that align with specific business objectives. The most critical metrics include conversion rate, average order value, customer acquisition cost, and customer lifetime value.
- What is the most important KPI for eCommerce?
Conversion rate is arguably the most important KPI for eCommerce, as it directly measures the percentage of visitors who complete purchases. However, the “most important” KPI depends on your specific business goals and growth stage.
- What’s a good conversion rate for eCommerce?
The average global e-commerce conversion rate in 2025 hovers between 2% and 4%, with significant variation across industries. A conversion rate higher than 2% is generally considered good.
- How often should I review my KPIs?
Review operational KPIs (like daily sales, traffic) weekly, strategic KPIs (like CAC, CLV) monthly, and conduct comprehensive quarterly reviews to adjust strategies and targets.
Key Takeaways
KPIs are your roadmap to eCommerce success. The key is choosing the right metrics that align with your business goals, setting realistic benchmarks, and taking consistent action based on the insights they provide.
Remember:
- Quality over quantity: Focus on 3-5 key metrics per goal
- Context matters: Always compare against industry benchmarks and historical performance
- Action-oriented: Every KPI should lead to specific business actions
- Regular review: Consistent monitoring and adjustment drive continuous improvement
Start with the basics: conversion rate, AOV, and CAC. And then expand your KPI tracking as your business grows and your needs become more sophisticated.

WordPress, automation, eCommerce and growth marketing specialist, a Core Contributor and Media Corps member blending storytelling with technology to craft purposeful strategies in SEO, email marketing, and beyond.

Subscribe now
Related Articles and Topics
-

What Is FIFO? How It Works in Retail & eCommerce
Learn what is FIFO (First In, First Out), how it works, and also why it matters for your…
-

What Is Liquidation? Process, Types & Who Gets Paid
Understand what liquidation means, its types, step-by-step process, and who gets paid first when a company is dissolved.
-
What is Retail? Definition, Types, and How It Works in 2026
Learn what retail means, how the supply chain works, types of retail businesses, and what makes a successful…


Leave a Reply